Viewing Real-time Collection of Syslog Messages
Once you have set up Syslog Viewer to collect syslog messages (see Collecting Syslog Messages Methods), syslog messages are automatically displayed in the window as they are sent by the device.
Syslog Viewer automatically formats the syslog messages for easy reading of SIP messages. Messages with warning severity level are displayed in magenta and messages with errors are displayed in red.
| ➢ | To start and stop collecting syslog messages: |
| 1. | Make a few calls or perform configuration or management actions on the device. For example, configure a parameter or restart the device; Syslog Viewer collects and displays the syslog messages, including sent and received SIP messages. The 'Syslog Listener' field on the status bar displays "UDP" or "TCP", indicating the transport protocol over which the syslog messages are being collected. |
| 2. | To pause collection of syslog messages, on the toolbar, click the Pause  icon. The 'Syslog Listener' field on the status bar displays "OFF". icon. The 'Syslog Listener' field on the status bar displays "OFF". |
| 3. | To resume collection of syslog messages, on the toolbar, click the Play  icon. icon. |
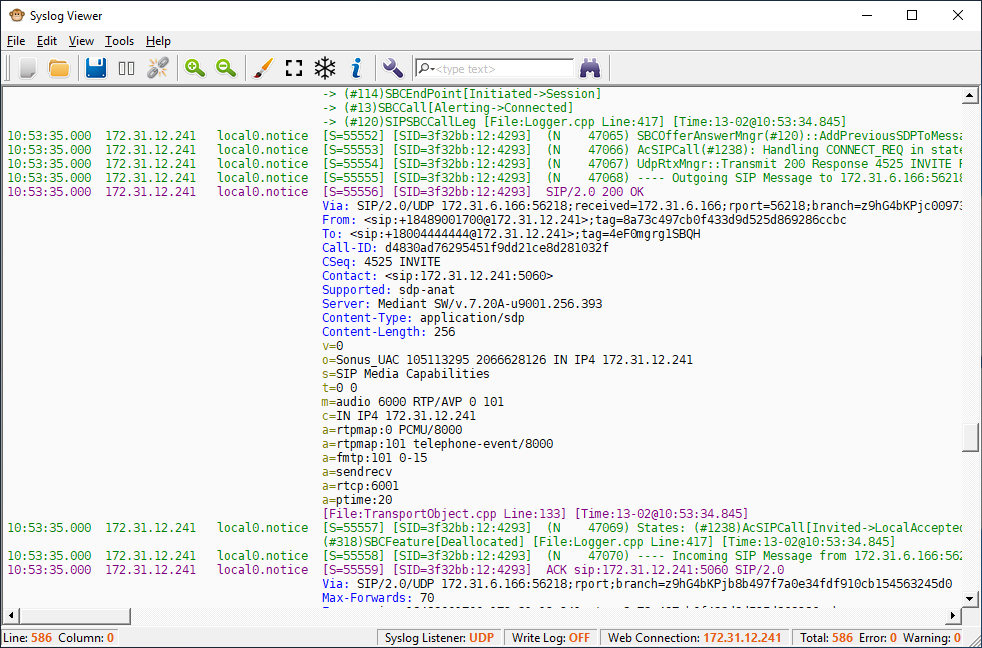
The following figure shows an example of a collected syslog message that's a SIP call:
SIP Call
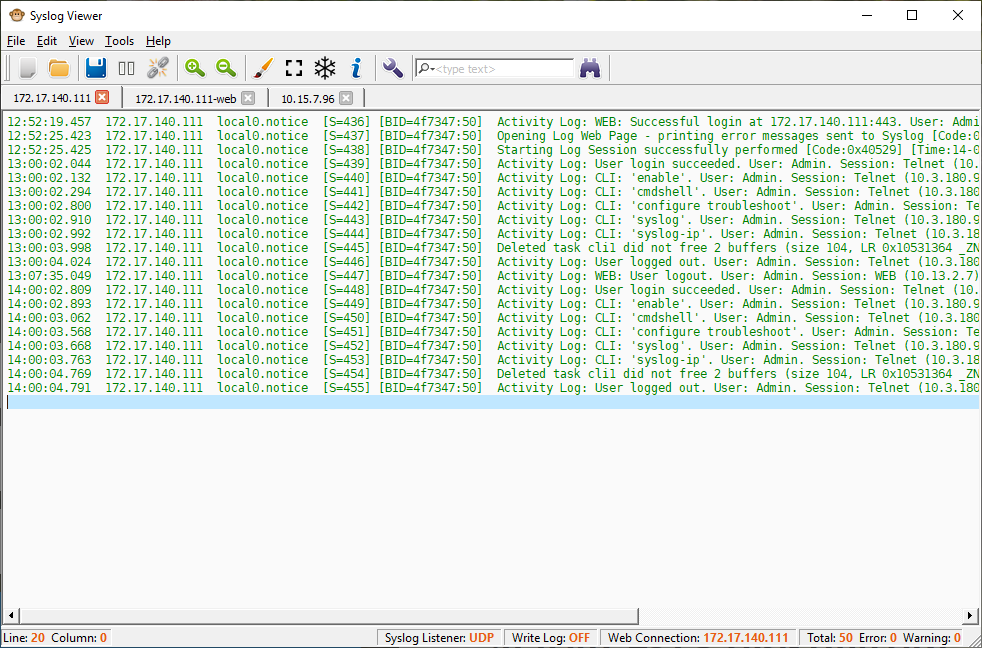
The following figure shows an example of a collected syslog message that's a user activity event:
Activity Log